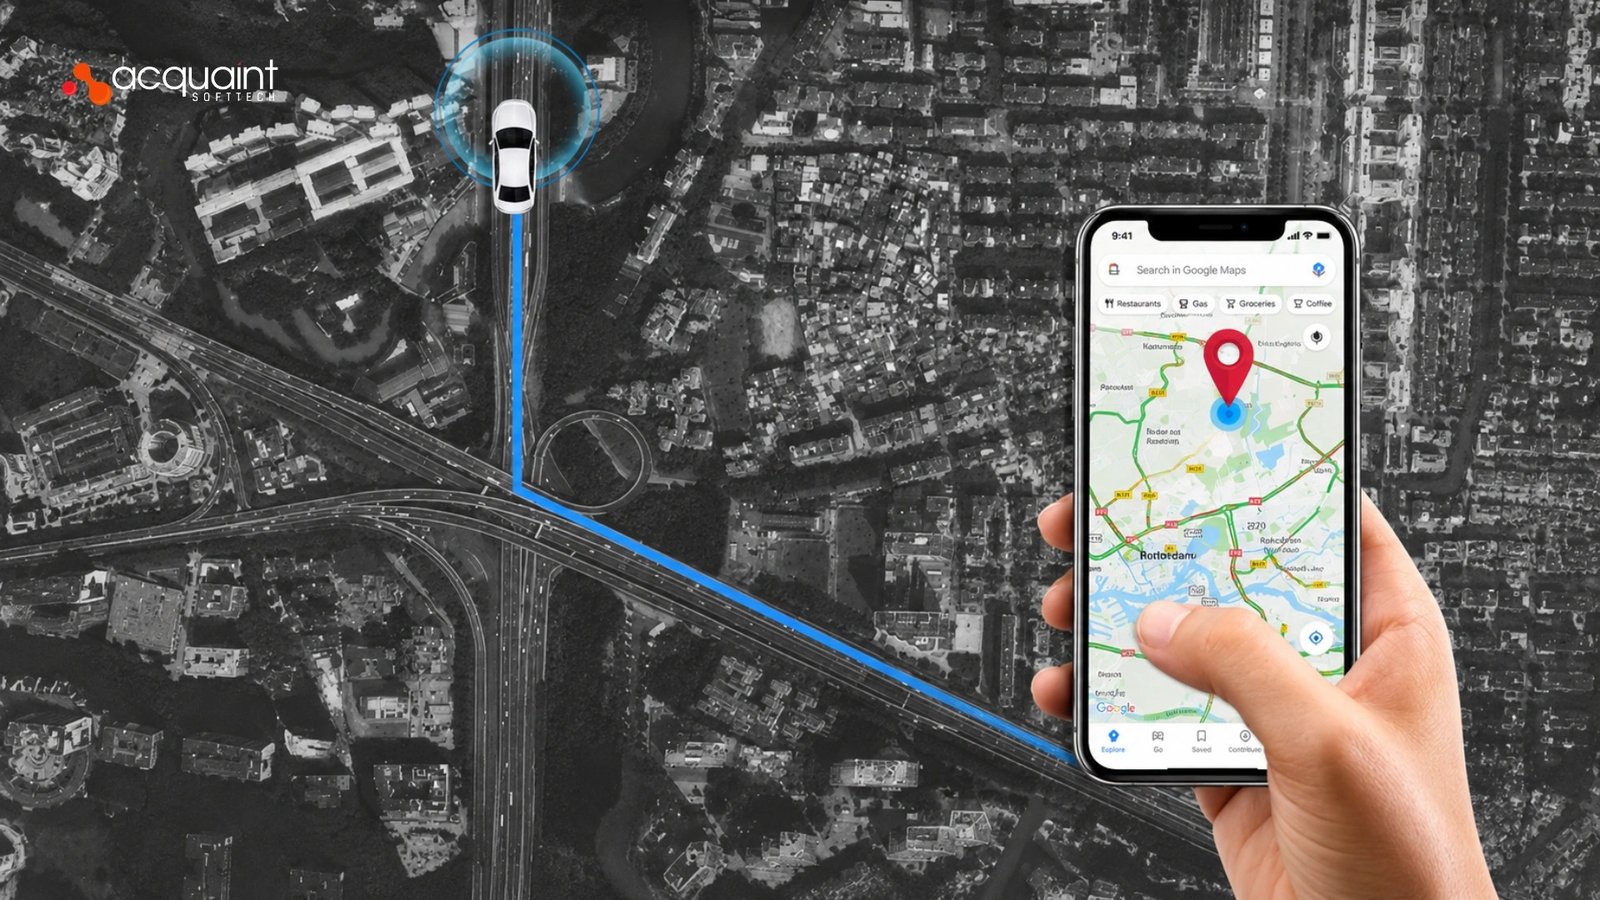
Real-Time Vehicle Tracking: Building a GPS Fleet Dashboard With Live Maps and Geofencing
| What This Guide Covers 1. The Problem: Why Phone-Call Fleet Tracking Fails 2. What a Real-Time GPS Fleet Dashboard Does 3. The Architecture: How Live Location Streaming Works 4. Choosing a Map API: Leaflet vs Google Maps vs Mapbox 5. Geofencing: How Zone Alerts Actually Work 6. Streaming at Scale: WebSockets, MQTT, and Offline Buffering 7. Building the Dashboard Front End 8. Cost and Timeline to Build (US, UK, and EU) 9. Case Study: A Custom Platform Built to Fit |
The Problem: Why Phone-Call Fleet Tracking Fails
Most fleets that come to us are still tracking vehicles the slow way: a dispatcher phones a driver to ask where they are, writes it on a whiteboard, and the answer is stale before the call ends. As the fleet grows, that approach quietly breaks.
A late delivery is discovered only when the customer complains, an idling truck burns fuel nobody is watching, and a stolen or misused vehicle is gone before anyone notices. Building a proper GPS vehicle tracking dashboard with geofencing is what turns that guesswork into a single live screen, and it is exactly the kind of real-time product our MERN stack developers build.
There is a compliance dimension too, and it is worth grounding in official rules. In the United States, the Department of Transportation, through the Federal Motor Carrier Safety Administration ELD mandate, requires most commercial vehicles to run GPS-equipped electronic logging devices for hours-of-service records. That means the location data already exists in most fleets; the missing piece is a dashboard that turns it into something a manager can actually use.
The gap, then, is not data collection. It is presentation, alerting, and speed. A dashboard that shows live positions, fires geofence alerts, and keeps a history is what closes it. For the wider system this dashboard belongs to, our guide on logistics and supply chain software development sets the full picture.
What a Real-Time GPS Fleet Dashboard Does
A real-time fleet dashboard does four things a phone call cannot. It shows every vehicle as a live marker on a map that moves as the vehicle moves. It fires alerts automatically when a vehicle crosses a geofence, speeds, or idles too long. It keeps a route history so any trip can be replayed and audited. And it surfaces the whole fleet at a glance, so one person can oversee dozens of vehicles instead of chasing each one. Building that into one coherent product is the work of our software product development team.
The shift this creates is from reactive to proactive. Instead of learning about a problem after it costs money, the manager sees it as it happens: the truck that left its delivery zone, the vehicle parked for an hour it should not be, the route that drifted off plan. In fleets we have worked with, that visibility is what turns tracking from a cost into a saving. The driver-side mobile app that reports location, and any customer-facing tracking view, is built by our React Native developers.
How this fits the wider vehicle data picture, including telematics and maintenance, is covered in our guide on how fleet management systems work.
The Architecture: How Live Location Streaming Works
Under the hood, a live dashboard is a streaming pipeline, and getting its shape right is the whole game. Each vehicle sends a heartbeat, a small message with its position, speed, and status, every few seconds. That message travels through a broker into a backend that processes it, checks it against geofence rules, writes it to a database, and pushes the update to the browser. Designing that pipeline so it stays fast under thousands of messages a minute is exactly what our stack developers do.
The flow is best understood as a chain: vehicle GPS to a message broker, then a stream processor, then alerts and the dashboard, with the broker holding messages safely even if the connection drops briefly. The database matters as much as the pipeline. Raw location pings pile up fast, so the design separates the live position of each vehicle, which the map reads constantly, from the historical track, which is queried only when someone replays a trip.
A geospatial store such as PostGIS handles the zone and proximity queries that geofencing depends on. Keeping that pipeline reliable under real load, with auto-scaling and monitoring, is the job of our DevOps engineers.
Choosing a Map API: Leaflet vs Google Maps vs Mapbox
The map library is the most visible decision in the build, and the right choice depends on cost, control, and the look you want. Leaflet is open-source and free, lightweight, and pairs naturally with OpenStreetMap tiles, which makes it the common starting point for fleet dashboards.
Google Maps offers the richest data and familiar visuals but bills per use, which adds up at fleet scale. Mapbox sits between them, with strong customisation and usage-based pricing. The table below is the quick comparison we walk clients through, and our MEAN stack developers have shipped all three.
| Map API | Best for | Cost model |
| Leaflet + OpenStreetMap | Full control, lean budgets | Free, open-source |
| Google Maps | Rich data, familiar look | Per-use billing |
| Mapbox | Custom styling at scale | Usage-based |
For most fleet dashboards we start with Leaflet, because the control and zero licence cost matter more than Google’s extra data, and the open-source plugin ecosystem covers real-time markers and clustering well. The choice is rarely permanent: the map layer can be swapped later if needs change, provided the architecture keeps it separate from the data pipeline. When the dashboard needs to grow into a full product with roles, reporting, and billing, that wider build runs through our software product development.
Geofencing: How Zone Alerts Actually Work
Geofencing is drawing a virtual boundary on the map and triggering an alert when a vehicle crosses it. A geofence can be a circle around a depot, a polygon around a delivery zone, or a corridor along a route. Every time a vehicle reports its position, the backend checks whether it is inside or outside a zone, and an entry or exit event triggers an alert. Businesses that need custom geofencing and fleet tracking features often choose to hire Laravel developers to build scalable, real-time tracking solutions.
That check is a geospatial query, which is why the database choice in the architecture matters so much, and it is core to the systems our MERN stack developers build. Geofencing earns its keep when the alerts map to real events: a vehicle arriving at a customer site, leaving an authorised area, speeding on a stretch of road, or idling longer than it should.
Each becomes an automatic notification rather than something a human has to watch for. Stored as events, those same alerts feed reporting and SLA auditing later. In practice, this is where a fleet first feels the dashboard paying off, because the system is now watching the things a dispatcher used to miss. For founders who want senior direction on which alerts to build first, our virtual CTO services provide that without a full-time hire. How geofence events feed routing and delivery flows is covered in our guide on how last-mile delivery software works.
Read Also: IT Logistics Services: The Foundation of Secure and Efficient Technology Management
Streaming at Scale: WebSockets, MQTT, and Offline Buffering
Two protocols do the heavy lifting in a live dashboard, and they solve different problems. WebSockets hold a persistent connection between the server and the browser, so the server can push a new position the instant it arrives instead of the browser asking repeatedly. That is what makes markers glide rather than jump. Getting that connection layer right under many simultaneous viewers is part of what our software development outsourcing engagements handle end to end.
MQTT is the protocol of choice between the vehicle and the server, because it is lightweight, survives poor connectivity, and uses far less data and battery than heavier alternatives. The two work together: MQTT brings data in from thousands of vehicles, and WebSockets push it out to the dashboards. The detail that separates a robust system from a fragile one is offline buffering.
Vehicles lose signal in tunnels, car parks, and rural gaps, so the device stores positions locally and uploads them in batches when the connection returns, with the backend deduplicating to prevent double-counting. The AI layer that turns this raw movement data into predictions, such as ETA or anomaly detection, is built by our AI development services. The modelling techniques behind those predictions are covered in our guide on AI and machine learning in logistics.
Building the Dashboard Front End
The front end is where all that engineering becomes something a manager wants to use, and React is the natural fit for it. The screen centres on the live map with vehicle markers, surrounded by a fleet list, status panels, and an alerts feed, all updating together as new data streams in. The hard part is performance: rendering hundreds of moving markers smoothly takes marker clustering, careful state updates, and only redrawing what changed.
Good fleet dashboards also respect the person using them. A dispatcher needs the map and alerts front and centre; a manager wants summaries and reports; a driver, if they see anything, needs a stripped-back view. Designing each of those without cluttering the others is what makes the difference between a screen people rely on and one they ignore. Clear, fast, and uncluttered always beats feature-stuffed.
Teams that already have engineers and just need to add real-time skills often bring them in through staff augmentation rather than hiring for one build.
Cost and Timeline to Build (US, UK, and EU)
Cost depends on fleet size, how many alert types you need, whether you build native mobile apps for drivers, and how much history and reporting you want. The honest way to budget is by stage, because a focused first version proves the live map before you commit to the full platform. The ranges below are what we quote as a starting point, shown in each target market’s currency. To keep that first version lean, we scope it in a discovery workshop before any code is written.
| Build stage | Indicative cost (USD / GBP / EUR) | Timeline |
| Live map MVP (tracking, basic geofence) | $30K-55K / £24K-44K / €28K-51K | 2 to 4 months |
| Full dashboard (alerts, history, reports) | $55K-110K / £44K-88K / €51K-102K | 4 to 7 months |
| Enterprise scale (large fleet, mobile apps) | $110K-220K+ / £88K-176K+ / €102K-204K+ | 7 to 12 months |
The biggest lever on these figures is where the work is done. Building with an experienced India-based team delivers the same engineering quality at up to 40 per cent below typical US, UK, and EU agency rates, which is why most of our fleet clients build offshore—the currency you pay in changes the bill, not the engineering.
A phased approach keeps that bill honest, because you see a working live map before committing to alerts, history, and mobile apps. Once live, keeping the system current as fleets and zones change is handled through our support and maintenance services.
For the regional rate differences behind the cost gap, our guide on Python development cost by industry breaks down the numbers.
Case Study: A Custom Platform Built to Fit
To ground this in real work, consider a multi-country operations platform Acquaint Softtech built for a custom manufacturer, verified on Clutch at five out of five. It solved the same core challenge as a live tracking system: providing a single, real-time view of operations across multiple locations. Backed by experienced teams, you can also hire Python developers from Acquaint Softtech; this approach reflects how we build scalable, real-time platforms.
The lesson maps straight onto a fleet dashboard. When your operation is spread out, and your current view is always stale, the path that wins is a custom system that streams everything into one real-time screen, exactly as it did here. You can review this and other delivered work in our portfolio of client case studies.
Proof of work matters more than promises, so it is worth verifying independently. Across 1,300+ delivered projects over 13+ years, Acquaint Softtech holds a 4.9/5 rating with Premier Verified status on our Clutch profile, drawn from 50+ client reviews.
Frequently Asked Questions
How do you build a fleet tracking dashboard?
Stream a location heartbeat from each vehicle every few seconds through a message broker into a backend, store positions in a geospatial database, check them against geofence rules, and push updates to a React front end over WebSockets so markers move live on a Leaflet or Google Maps map.
What is geofencing?
Geofencing is drawing a virtual boundary on a map, such as a circle around a depot or a polygon around a delivery zone, and firing an alert when a vehicle enters or leaves it. Each location ping is checked against the zone, and a change of state triggers the notification.
What is the best map API for a fleet dashboard?
Leaflet with OpenStreetMap is the common choice: open-source, free, and lightweight, with good real-time plugins. Google Maps offers richer data but bills per use, which adds up at fleet scale. Mapbox sits between them with strong styling and usage-based pricing.
How do you stream live GPS data?
Vehicles send lightweight MQTT messages that survive poor connectivity into a broker and stream processor on the backend. The browser receives updates over a persistent WebSocket connection, so positions are pushed instantly. Devices buffer pings offline and upload them in batches when the signal returns.
How much does a GPS fleet dashboard cost to build?
| Solution Type | USD / GBP Cost | EUR Cost |
| Live Map MVP | $30,000–$55,000 / £24,000–£44,000 | €28,000–€51,000 |
| Full Dashboard (Alerts, History & Reports) | $55,000–$110,000 / £44,000–£88,000 | €51,000–€102,000 |
How long does it take to build a fleet tracking dashboard?
A live map MVP with basic geofencing takes 2 to 4 months. A full dashboard with alerts, history, and reporting takes 4 to 7 months, and an enterprise build with a large fleet and driver mobile apps takes 7 to 12 months. Phased delivery lets you prove the live map first.